A four-month approval is easy to remember. The applications that have not finished are harder to see. We checked 505 community timeline reports to put those stories in context.
Data snapshot: October 12, 2026 at 22:49 Europe/Berlin. Voluntary, self-reported records; not an official forecast. Publication: October 13, 2026.
The findings in one minute
- Certificates received in 2026: 146 reports with usable dates had a median application-to-certificate wait of 367 days.
- Applications submitted in 2026: 135 reports contained 27 approved labels and 108 pending labels. The 25 already-finished reports with usable dates had a median of 119 days. That is a different group.
- After the first reply: 34 of 94 completed reports with usable first-response information took at least another 180 days to reach the certificate.
- Unfinished reports need follow-up: 227 of 290 pending records had no database edit in the previous 60 days. Their actual current status is unknown.
These are voluntary community reports, including applications submitted in earlier years. They are not an official forecast for a new applicant.
Advertising / affiliate links: the optional language-study section contains marked italki and Audible affiliate links. Citizify may earn a commission on eligible purchases or signups, at no extra cost to you. Reading this analysis and using the free resources require no purchase.
Why a four-month approval needs a denominator
Suppose you applied this year and see another applicant finish in four months. It is tempting to treat that as the new normal. The person who is still waiting cannot post a finished timeline yet.
In this snapshot, 135 reports were for applications submitted during 2026. Of those, 27 were marked approved and 108 were marked pending. Among the approved labels, 25 had dates suitable for measuring the completed wait. Their median was 119 days.
That number describes the early finishers. It leaves out all 108 recorded pending applications. It also leaves out two approved labels that did not pass the timing checks.
Now change the question. Look at people whose certificates were dated in 2026, regardless of the year they applied. The 146 usable records in that group had a median wait of 367 days. Many of those applications had started in an earlier year.
Both medians can exist in the same dataset. One answers “How quickly did the 2026 applications that have already finished get through?” The other answers “How long did these people wait before receiving a certificate in 2026?”
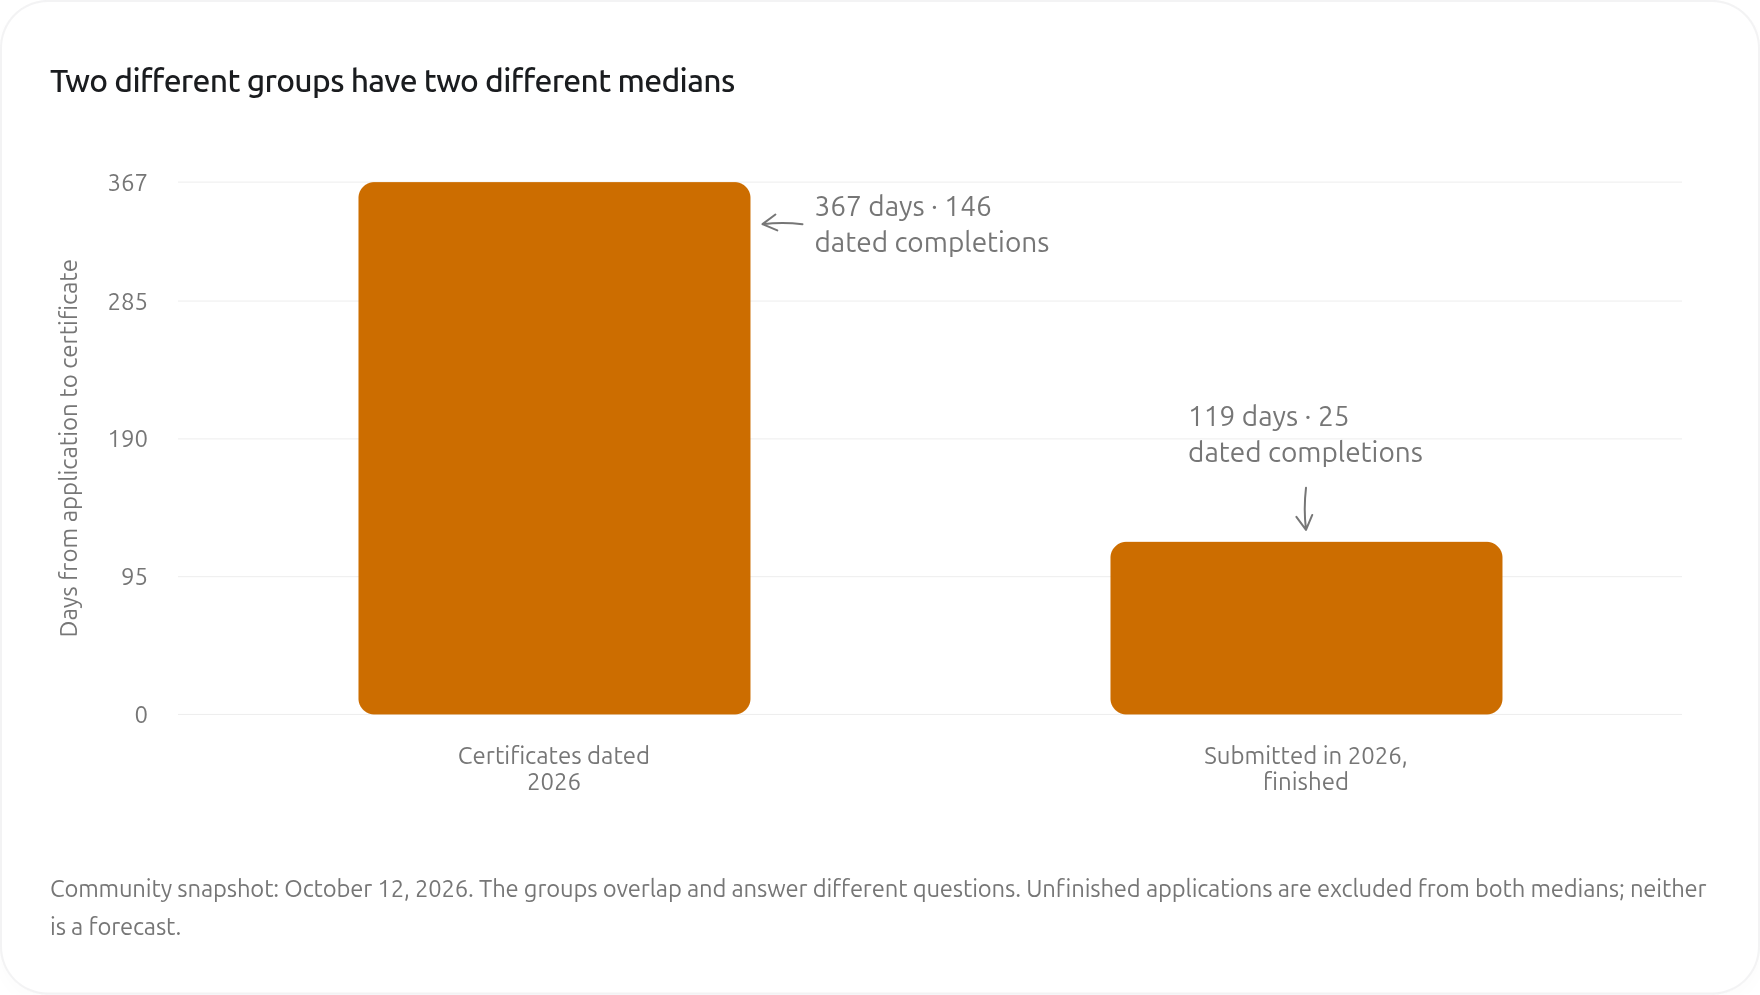
| Included reports | Dated completions | Median days | 25th percentile | 75th percentile |
|---|---|---|---|---|
| Certificates dated 2026 | 146 | 367 | 181.5 | 524 |
| 2026 applications already completed | 25 | 119 | 77 | 165 |
| All usable completed reports | 195 | 329 | 173 | 503 |
The 119-day number should not be offered as a forecast for all 2026 applicants. The 367-day number should not be offered as a forecast either: it comes from a self-selected set of completed reports.
If somebody gives you a waiting-time figure, ask two questions: When did those people apply? And were people still waiting included? If the answer is unclear, you cannot make a fair comparison with your own application.
Across all 195 dated completed reports, including older certificate years, the median was 329 days. Including those older completions changes the headline again. This is why the year printed above a chart needs a precise meaning.
Watch the application period, not just the success stories
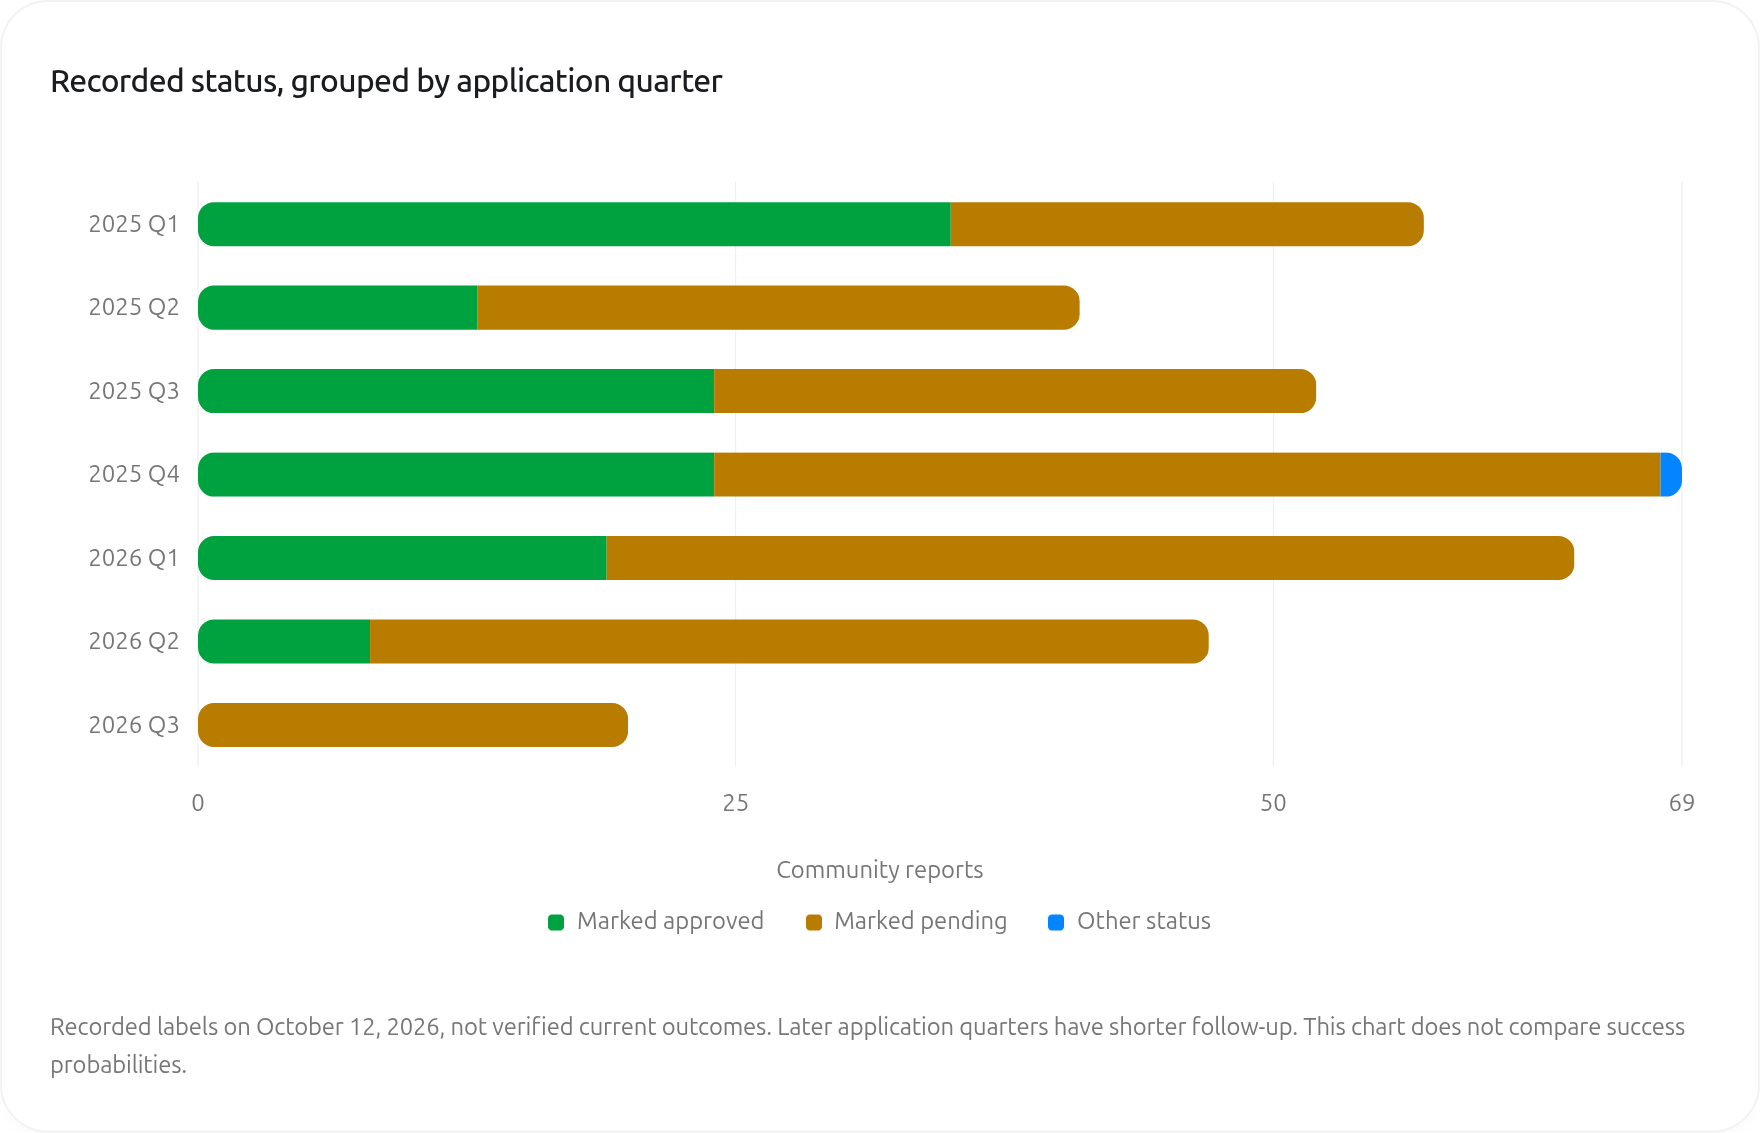
The chart below groups reports by the quarter in which the application was submitted. The colours show the status recorded in the snapshot.
For January–March 2026, there were 64 reports: 19 marked approved and 45 marked pending. For April–June, there were 47: 8 approved and 39 pending. All 20 July–September reports were still marked pending.
Those later applicants have had less time to receive an outcome. Reading the chart as a ranking of success rates would reward the oldest groups simply for being older. Four October–December records are omitted from the chart because the quarter had barely begun; they are included in the 135-report 2026 total.
Read the chart data
| Application quarter | All reports | Marked approved | Marked pending | Other |
|---|---|---|---|---|
| 2025 Q1 | 57 | 35 | 22 | 0 |
| 2025 Q2 | 41 | 13 | 28 | 0 |
| 2025 Q3 | 52 | 24 | 28 | 0 |
| 2025 Q4 | 69 | 24 | 44 | 1 |
| 2026 Q1 | 64 | 19 | 45 | 0 |
| 2026 Q2 | 47 | 8 | 39 | 0 |
| 2026 Q3 | 20 | 0 | 20 | 0 |
For your own comparison, start with the same authority and a similar submission period. Then look at the type of application and the point where the person started their clock.
An initial request for an appointment, the day an application was submitted, a first acknowledgement and a certificate appointment are different milestones. A six-month story measured from one of those dates can be a very different experience from a six-month story measured from another.
Our benchmark uses the contributor’s application date and certificate date. It cannot establish whether every contributor interpreted “application submitted” in exactly the same way.
The middle of the sample still covers a wide range
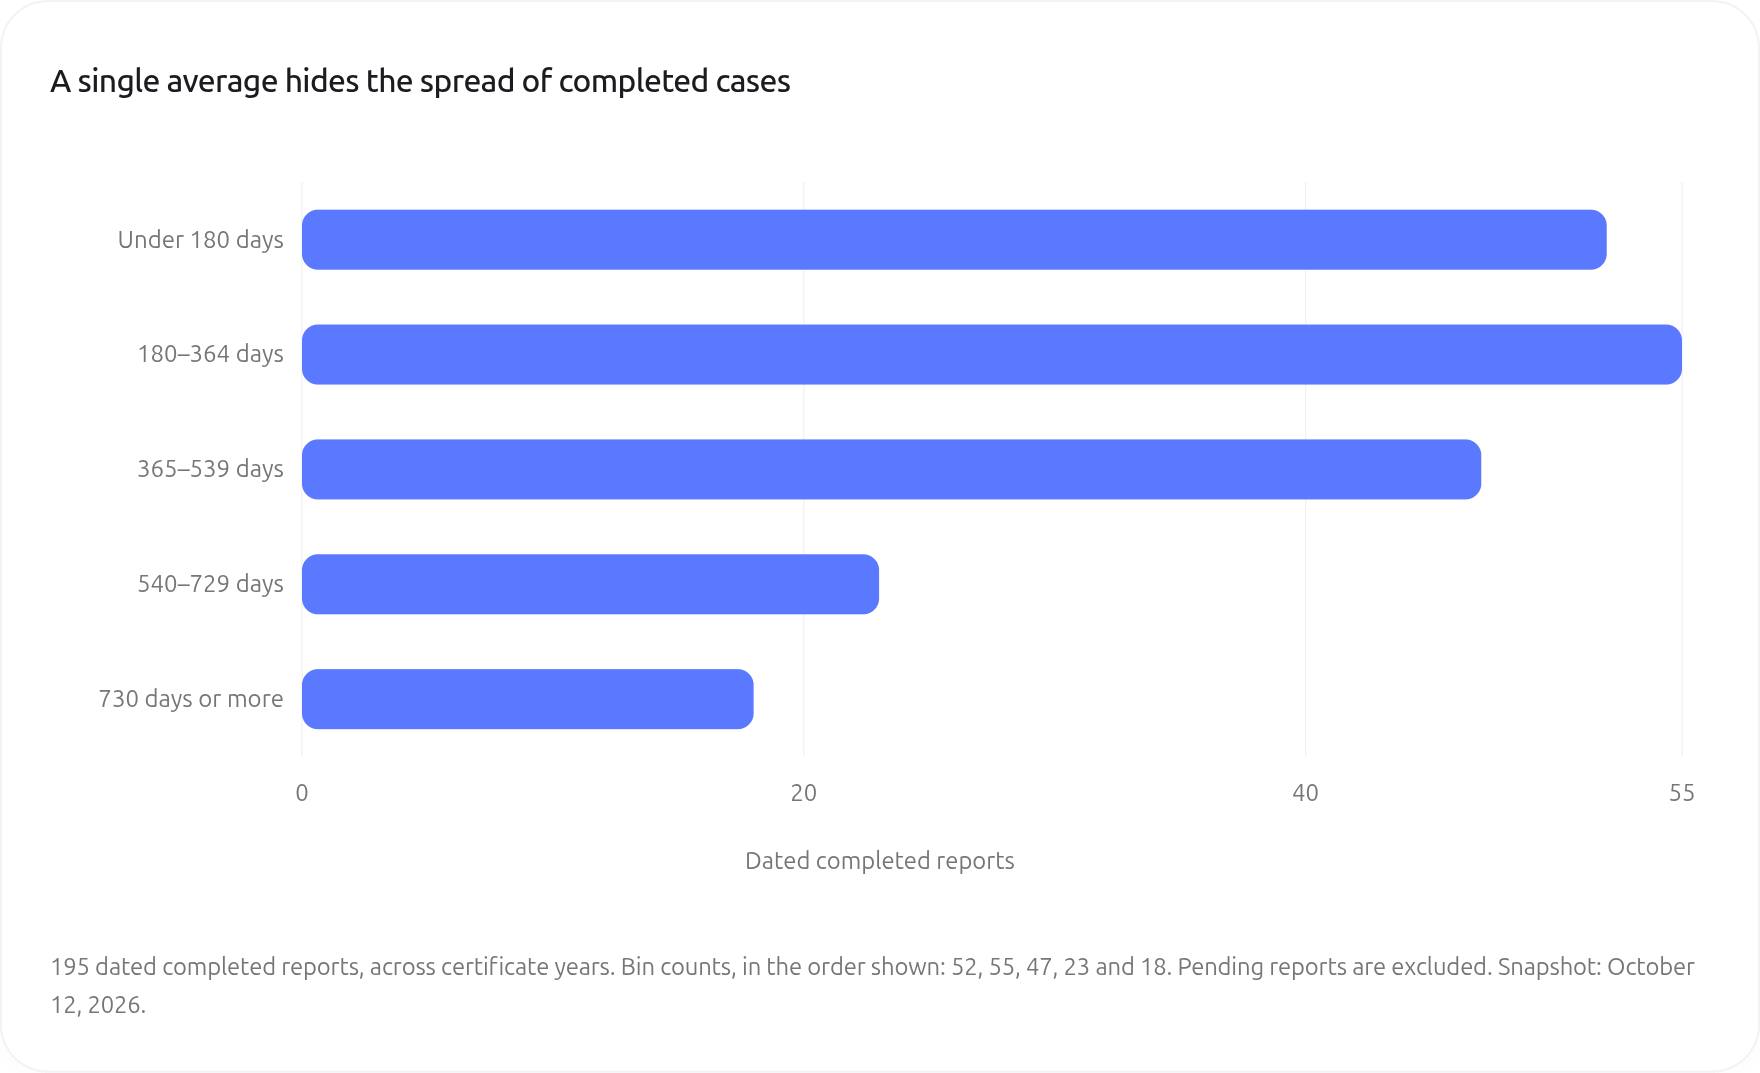
The 195 eligible completed reports had a median of 329 days. The middle half fell between 173 and 503 days. That is a considerable spread around an otherwise neat headline.
There were 52 completions in under 180 days, while 88 took at least 365 days. Eighteen took at least 730 days. These figures describe finished reports across certificate years; they do not include unfinished applications in the distribution.
Read the chart data
| Application to certificate | Reports |
|---|---|
| Under 180 days | 52 |
| 180–364 days | 55 |
| 365–539 days | 47 |
| 540–729 days | 23 |
| At least 730 days | 18 |
A wait above a sample median does not explain why your application is taking longer. These records do not contain a consistent history of document completeness, security checks, staff workload or every exchange with the authority.
The useful lesson is about expectations. Short waits occur, and so do much longer ones. A single average cannot tell you where your file is in a queue or whether a particular delay is avoidable.
Getting a first reply can leave a substantial wait
For 94 completed reports, we had a usable total duration and a plausible reported time to first response. We subtracted the latter from the former within each report.
The median time after that first reply was 123.5 days. The middle half of these remaining waits ran from 54.5 to 239.75 days. 34 of the 94 reports took at least another 180 days; 12 took another 365 days or more.
Even an early reply did not consistently mean an early finish in this sample. Of the 26 completed reports with a first response within 30 days, 7 still took at least a full year from application to certificate.
Keep the date of a first response, but also keep its meaning. Was it an automatic receipt, a file number, a request for documents, an interview invitation or a decision?
The form does not distinguish those types of contact consistently. The remaining-wait calculation therefore cannot show how long a specific administrative step normally takes.
An acknowledgement is useful evidence of contact. It gives you no measured completion date. The first-response median and the remaining-wait median also should not be added together: medians from different parts of the same records do not necessarily add up to the median total.
Check the local sample before comparing waits
The snapshot covers 96 recorded locations. Only eight have at least 10 reports of any status. A large number of city pages therefore does not mean that every location has enough completed cases for a meaningful timing comparison.
Berlin has the largest sample: 132 reports, including 54 usable dated completions. Their median elapsed time was 245 days. Munich has 16 usable dated completions, with a median of 605.5 days. Aachen has 14, with a median of 392 days.
These are historical sample descriptions. They mix submission periods and application circumstances, so they do not establish that moving from one city to another would shorten a particular person’s wait.
| Location | All reports | Marked pending | Dated completions | Median days | Middle half, days |
|---|---|---|---|---|---|
| Berlin | 132 | 76 | 54 | 245 | 136–358.75 |
| München | 50 | 29 | 16 | 605.5 | 568.5–722.5 |
| Aachen | 33 | 17 | 14 | 392 | 318.5–408.25 |
| Hamburg | 20 | 15 | 4 | — | Not shown: fewer than 10 dated completions |
| Stuttgart | 16 | 6 | 7 | — | Not shown: fewer than 10 dated completions |
| Frankfurt am Main | 11 | 9 | 1 | — | Not shown: fewer than 10 dated completions |
| Köln | 11 | 5 | 5 | — | Not shown: fewer than 10 dated completions |
| Nürnberg | 11 | 9 | 2 | — | Not shown: fewer than 10 dated completions |
For this report, timing is shown only when a location has at least 10 eligible dated completions. That is a publishing threshold, not a statistical guarantee. A location can appear with its report counts while its duration remains unshown.
Hamburg is a useful example: it has 20 reports, but only 4 approved records with usable start-to-certificate dates. A precise city-wide waiting-time claim from those four would hide how little evidence sits behind it.
Location labels also need care. A report for Winsen (Luhe) / Landkreis Harburg was previously entered under Hamburg. That record has been corrected. This report uses the corrected snapshot, but the correction does not mean that every other location has been independently verified.
The unknown outcome is the biggest weakness in the pending data
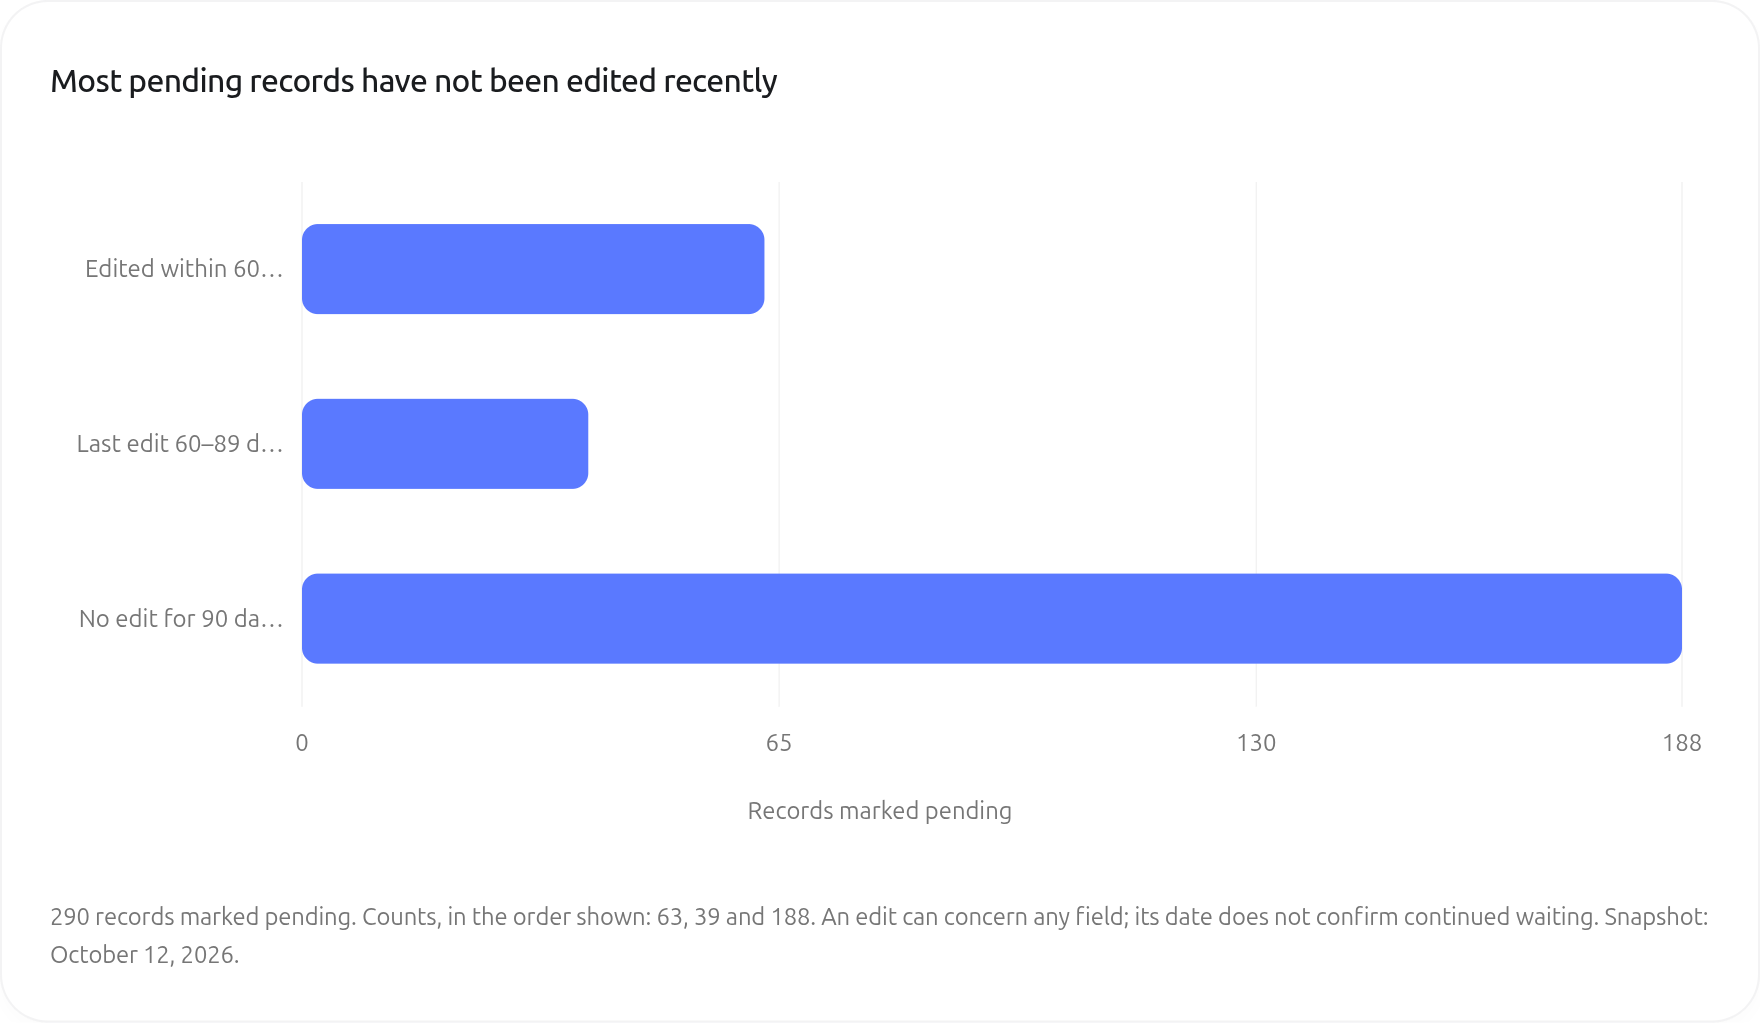
There are 290 records marked pending. 227 have no database edit in the previous 60 days. Of those, 188 have no edit in 90 days or more.
Some contributors may still be waiting. Others may have received an outcome and never returned to update their entry. This snapshot cannot distinguish them.
That means “108 of 135 applications submitted in 2026 are marked pending” describes the stored records. It is not proof that exactly 108 of those applicants are still waiting today.
Read the chart data
| Age of last edit | Reports |
|---|---|
| Within the last 60 days | 63 |
| 60–89 days ago | 39 |
| At least 90 days ago | 188 |
A recent edit is not a verified status confirmation either. It might concern a location, a note or another field. The database timestamp tells us when the record changed, not precisely when the contributor last confirmed “I am still waiting”.
This is why we have not fitted an approval-date predictor or presented a nationwide chance of approval by month six. An unfinished case needs a reliable observation date for that type of analysis.
If you previously submitted a report, updating your outcome is one of the most useful things you can do for the next reader. A final date adds a completed observation. A clearly dated “still waiting” update makes the unfinished observation more useful.
Language level does not supply a shortcut to a waiting-time forecast
The recorded B1 group had 114 dated completed reports and a median duration of 308 days. The C1 group had 32 and a median of 337 days. The higher-level group did not have a shorter raw median here.
That comparison is unadjusted. Different authorities, submission years, application routes and other circumstances can explain the difference. It is not evidence that learning more German slows an application, or that language qualifications never matter.
| Reported language level | Dated completions | Median days |
|---|---|---|
| B1 | 114 | 308 |
| B2 | 23 | 352 |
| C1 | 32 | 337 |
| C2 | 13 | 466 |
| Not recorded | 13 | 390 |
The official Make it in Germany guide describes the usual B1 language requirement, along with other conditions and route-dependent exceptions.
Preparing the evidence your own route requires is a practical goal. This dataset does not support spending money on a higher language certificate because someone promises it will move you ahead in an authority’s queue.
For readers still preparing their German
If language preparation is your remaining step, start with the free resources and the exam format you actually need. Citizify’s Goethe B1 writing guide includes original practice answers and a two-week practice plan.
For individual feedback, explore teachers on italki and ask whether they work with your exact exam format before booking. Audible is an optional source of German listening material; check a sample and choose a level you can follow. Neither service provides a measured shortcut through citizenship processing.
The italki and Audible links below are affiliate links. Check the provider’s current prices, subscription terms and eligibility on its own screen. You can read this report and use the free materials without buying either.
Free learning resourcesGoethe B1 writing practice
How to use the numbers without misleading yourself
If you have not applied yet: read your authority’s official requirements and distinguish an appointment request from the date your application is submitted. A fast story from another location gives you no reliable timetable for your own file.
If you are waiting for a first response: keep the submission evidence and record every acknowledgement. When comparing timelines, check whether the reported first response was merely a receipt or a substantive message.
If you have a file number or document request: record that stage separately. Our paired reports show that substantial waits can follow a first reply. The report cannot assess whether your particular file is complete or whether a legal remedy is appropriate.
If somebody who applied later has finished: check that you are comparing the same authority, a similar route and the same starting milestone. This sample does not reveal a strict first-in, first-out queue.
If your own report is still marked pending: add an outcome when you have one. Until then, a dated status update is more useful than leaving an old record untouched.
National totals provide context, not a personal clock
Destatis recorded 332,524 naturalisations in 2025, in preliminary national figures. That is an annual outcome count, not a waiting-time forecast. Our 505 voluntary reports cannot estimate Germany’s citizenship backlog. Official table
How the report was checked
The fixed snapshot was taken on October 12, 2026 at 22:49 Europe/Berlin. It contained 505 timeline records: 213 marked approved, 290 marked pending and 2 with another status. These are reports, not 505 independently verified unique applications.
For the duration benchmark, we required a usable application date and certificate date, in calendar order, with the certificate no later than the snapshot date. Eighteen approved labels did not meet those checks. The remaining 195 form the all-year dated-completion benchmark; 146 of them have certificate dates in 2026.
The exclusions are listed below. No source record was deleted or changed to make the report.
| Exclusion reason | Reports |
|---|---|
| Missing application or certificate date | 11 |
| Certificate date after the snapshot | 6 |
| Certificate date before application | 1 |
Definitions and missing fields
- Duration: certificate date minus application date, using Europe/Berlin calendar dates. A date labelled “final decision” is not silently substituted for a missing certificate date.
- Median and middle half: the 50th percentile and the 25th–75th percentiles, with linear interpolation. They describe these reports rather than a guaranteed future wait.
- 2026 certificates: usable completed reports whose certificate dates fall in 2026, even if the application was submitted earlier.
- 2026 applications: reports whose submission dates fall in 2026 through the snapshot date. Recorded status counts and usable duration counts remain separate.
- First response: the contributor’s reported days to first response. Only 94 dated completed reports had a nonnegative value no longer than their total duration. Two values outside that range were excluded from this paired calculation; 99 of the 195 records had no first-response value.
- Pending freshness: age of the last database row edit. It is not an independently confirmed observation of continued waiting.
Checks that can change the result
There were 19 eligible dated approvals whose stored total differed from the date-based calculation; 8 differed by more than seven days. This report uses the dates consistently rather than switching definitions for individual rows. Its results can therefore differ from site counters that use stored contributor totals.
Three pairs of records shared the same account and key timing/status fields. They might be repeated reports or legitimate family applications. Removing one record per matching signature did not change the 195-report timing benchmark. We kept the records in the main inventory and made no claim that every record represents a different person.
Small samples, self-selection, uneven location coverage, mixed application years and unknown later outcomes remain material limits. Missing values are kept as missing. We did not reconstruct unrecorded document checks, decide whether a legal route was valid or assign a future approval date.
The July report used 347 records and a different snapshot. Comparing its headline directly with this report would mix newly contributed records, possible updates and timing definitions. It would not establish that an authority has accelerated or slowed down.
Download the aggregate data (JSON)
Make your next update useful to somebody else
If you have a result, add the date. If you are still waiting, say when that status was last true. If your location is a Landkreis rather than the nearby city, check the authority label before saving.
You can browse your location or update your own timeline. City-following and notification settings are available after signing in. Each accurate update makes the next comparison less dependent on the few people who happened to finish quickly.
Citizify is a community project, not a government authority. This report provides descriptive research, not a decision on eligibility or a legal assessment of an individual application.